Check the new charts!

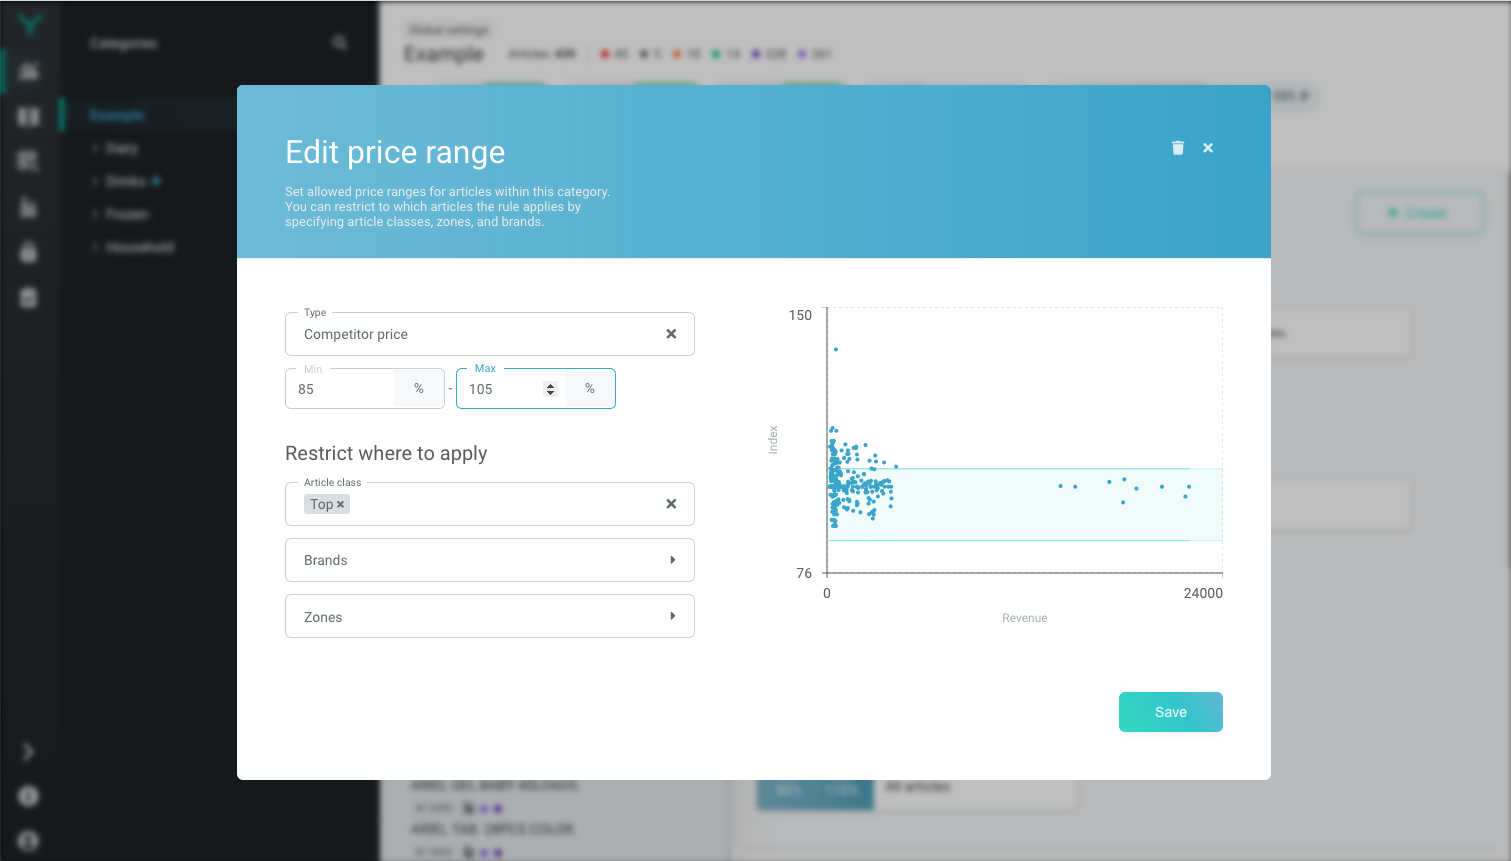
Price range setting assistance

We have added a helpful chart right to the range setting window. It shows you a relevant view of your current prices and the range you’re setting.
The y-axis shows the corresponding price index or margin of individual articles and the x-axis presents its revenue over last 30 days.
This allows you to get an idea of where the current prices stand and what kind of effect to expect from the set range.

Feature Ranges Chart

Share the Post:

Related Posts

Building In-House vs. Purchasing Specialized Price Management Software

Should your retail business build its own in-house pricing tool, or purchase a specialized price management software from an external vendor? Gain truly valuable insights into what it takes to build a successful in-house tool, while also learning the clear advantages and reduced risk that come with adopting an external price management solution.

Read More

Tell us where to send you the Case Studies?