Price range setting assistance
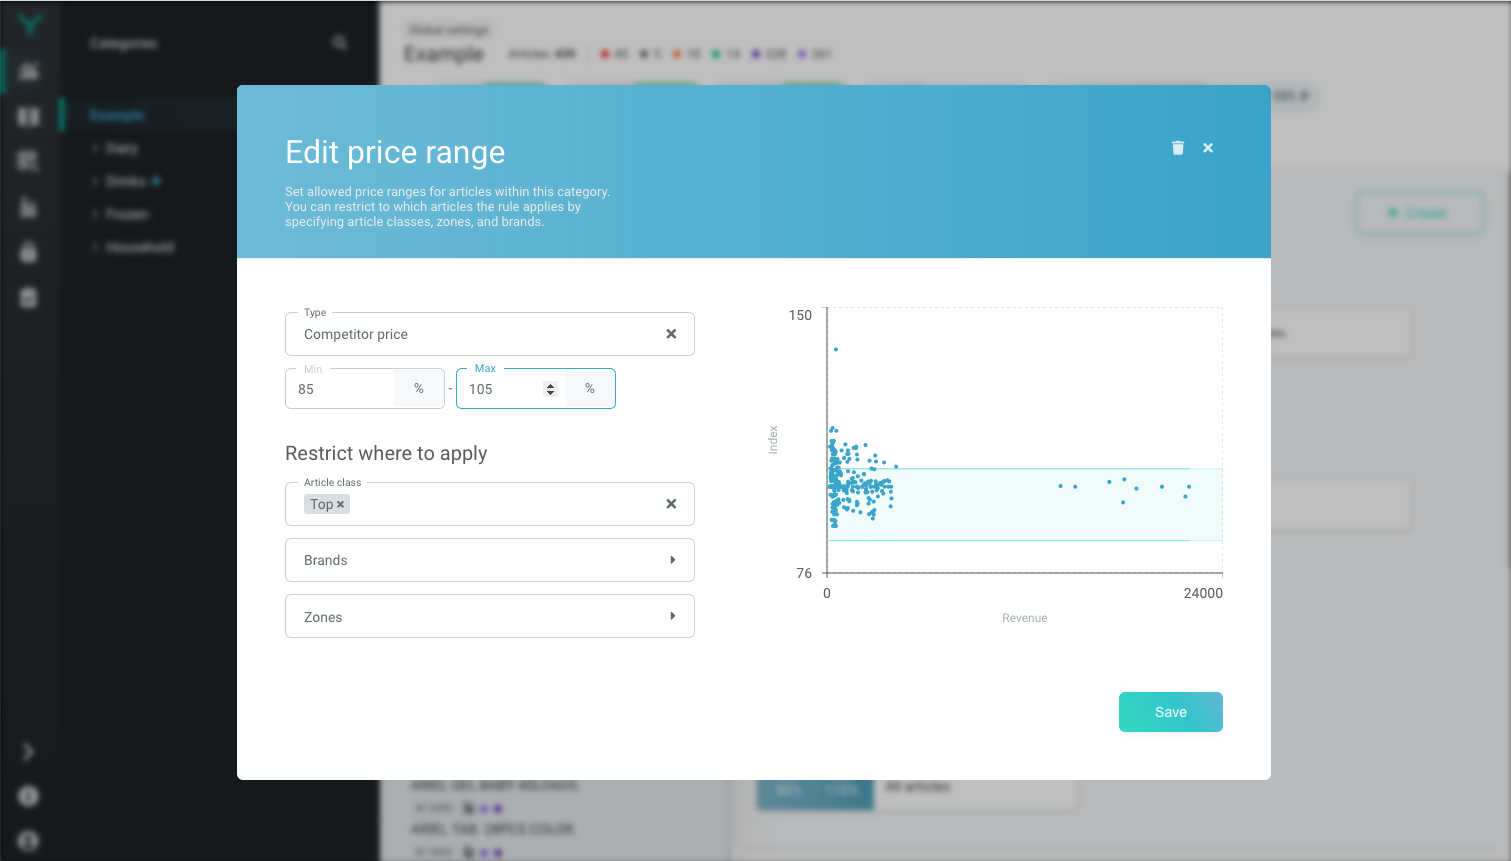
We have added a helpful chart right to the range setting window. It shows you a relevant view of your current prices and the range you’re setting.
The y-axis shows the corresponding price index or margin of individual articles and the x-axis presents its revenue over last 30 days.
This allows you to get an idea of where the current prices stand and what kind of effect to expect from the set range.

